Microsoft Excel: How a 40-Year-Old Grid Turned One Billion Office Workers into Programmers—and Outlived Every SaaS Built to Kill It
There is an old joke among Silicon Valley venture capitalists that happens to be entirely true: “Every B2B SaaS unicorn funded over the past twenty years simply took one column out of Microsoft Excel, wrapped it in a pretty web UI, and charged $50 per seat—and the very first feature every enterprise customer demands is an ‘Export to Excel’ button.”
Beneath that punchline lies the most humbling reality in software history: the true operating system of global civilization is neither Windows nor Linux. It is Microsoft Excel.
From 3:00 a.m. Wall Street LBO models and Yiwu factory inventory ledgers to Formula 1 car part trackers and World Health Organization epidemiological tables, wherever money and atoms move across the planet, they eventually pass through a green grid of 1,048,576 rows by 16,384 columns.
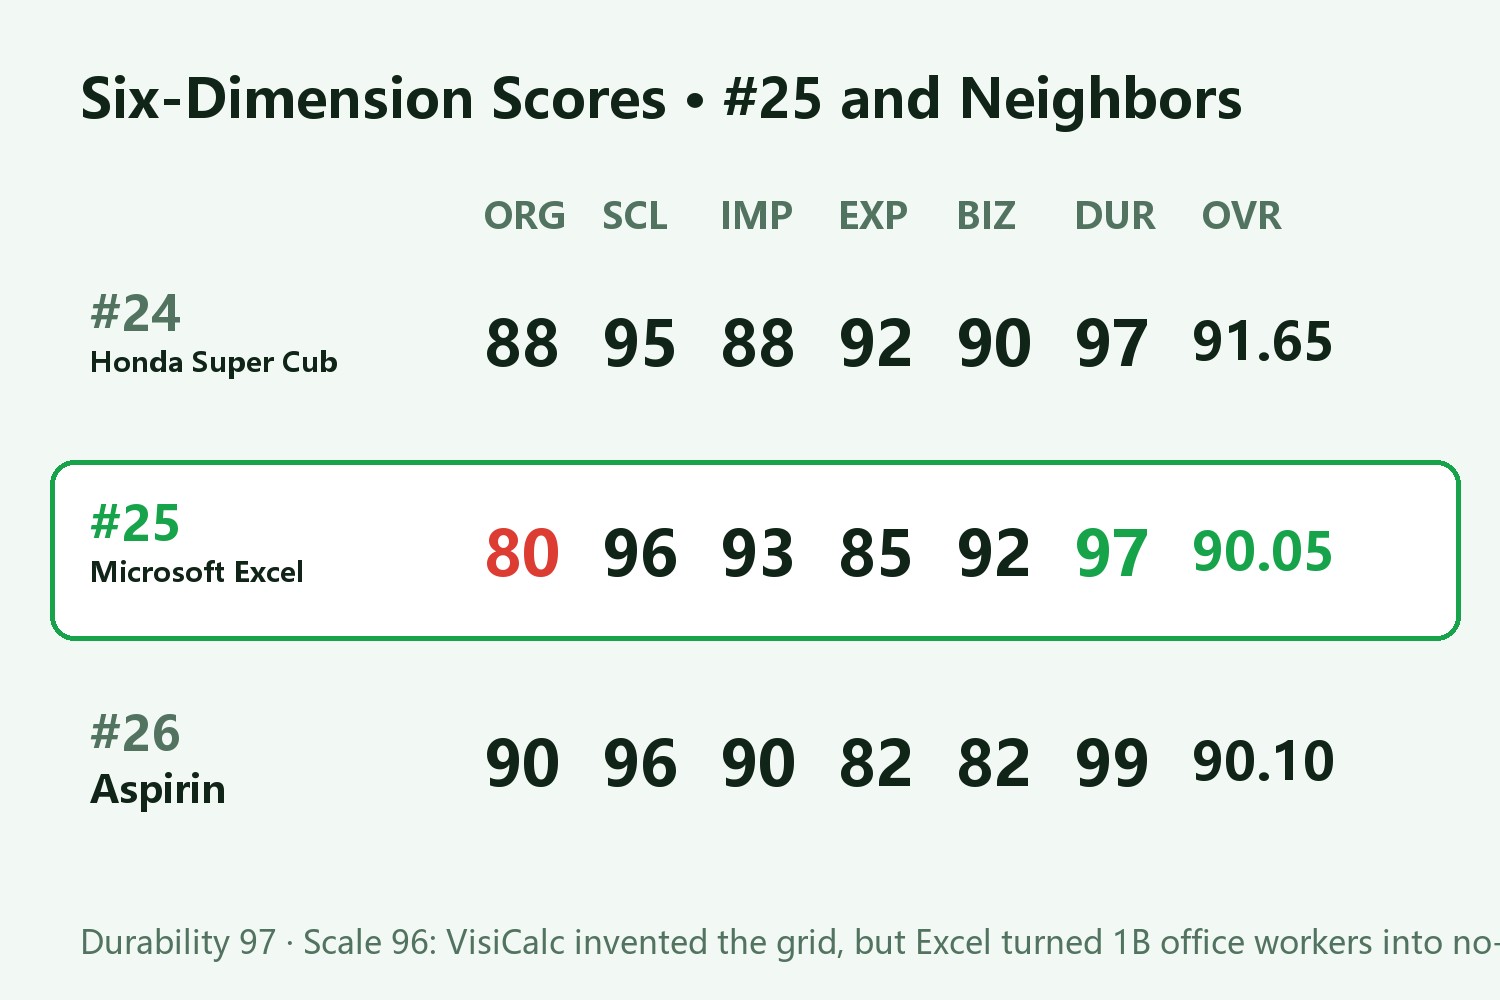
In our ranking of the 100 Products That Changed the World, Microsoft Excel stands at #25 with an overall score of 90.05 (evaluated by Claude AI under our unified six-dimension framework): 97 in Durability, 96 in Scale, 93 in Impact, 92 in Business, 85 in Experience, and 80 in Originality.
Its originality score is modest because Microsoft did not invent the electronic spreadsheet. Yet its scale and durability are nearly unmatched: 41 years after its 1985 debut, Excel commands more than one billion active users and remains the world’s most successful stealth programming environment.
1. The Latecomer’s Ambush: How Betting on the Macintosh GUI Toppled Lotus 1-2-3
It is easy to forget today that in 1984, Microsoft was a hopeless underdog in spreadsheets. Lotus 1-2-3 owned the IBM PC market with a 70%+ share, while Microsoft’s text-based spreadsheet, Multiplan, was getting crushed.
Had Microsoft tried to fight Lotus head-on inside the black-and-white DOS command prompt, it would have lost.
Instead, in 1984 Bill Gates and Excel lead architect Doug Klunder made one of the greatest platform pivots in software history: they killed their DOS spreadsheet roadmap and went all-in on the graphical user interface (GUI) of Steve Jobs’s brand-new Apple Macintosh.
At the time, industry veterans thought Gates was out of his mind. Corporate accountants used IBM PCs, not underpowered Macs with mice.
Yet when Excel 1.0 for Macintosh shipped in September 1985, Klunder’s team unveiled two weapons that made every DOS spreadsheet feel prehistoric:
- Intelligent Minimal Recalculation: In VisiCalc and Lotus 1-2-3, changing a single number forced the software to recalculate every cell in the entire worksheet from top to bottom, freezing the computer for seconds. Klunder spent two years engineering a dependency-graph recalculation engine that only recomputed the exact cells affected by the change, making Excel nearly ten times faster on complex financial models;
- Mouse-Driven WYSIWYG Formatting: For the first time, analysts didn’t have to memorize cryptic slash commands (
/WGC). They could click and drag across cells, apply bold headers, draw borders, and print boardroom-ready financial statements directly.
Two years later, in November 1987, Microsoft launched Excel 2.0 for Windows. While an arrogant Lotus Development Corp. clung to DOS and fumbled its Windows transition until 1991, Excel swept corporate America. Within five years, Excel’s market share surged past 70%, dethroning Lotus and turning Windows itself into the mandatory corporate desktop OS.
| Spreadsheet Era & Contender | Launch | Core Technical Breakthrough | Ultimate Fate |
|---|---|---|---|
| VisiCalc (The Pioneer) | 1979 | Invented the A1 row-column grid and automatic recalculation on the Apple II | Unpatented and slow to adapt to the IBM PC; acquired by Lotus and discontinued |
| Lotus 1-2-3 (The DOS King) | 1983 | Hand-coded x86 assembly speed + integrated charting; owned 1980s Wall Street | Clung to DOS keyboard macros and missed the Windows GUI shift; sold to IBM in 1995 |
| Microsoft Excel (The Hegemon) | 1985 | Minimal recalculation + GUI mouse selection + VBA + PivotTables + Turing-complete formulas | Ruled global business for 41 years; 1B+ users; anchor of Microsoft’s $1T+ Office franchise |
| Google Sheets / Airtable | 2006+ | Browser-native real-time multiplayer collaboration and cloud APIs | Won lightweight collaboration, but still bows to Excel on heavy financial modeling |
2. Why No SaaS Can Kill Excel: The Zero-Floor, Infinite-Ceiling Reactor
For product managers, the most fascinating question in enterprise software is simple: why have forty years of ERP suites, BI dashboards, and low-code platforms failed to dislodge Excel?
Because Excel achieved something almost no other software product has ever pulled off: it combined a zero-friction floor with a Turing-complete ceiling, turning a billion non-technical office workers into functional, reactive programmers without ever uttering the word “code.”
Conventional enterprise software separates state from logic:
- The database lives hidden on a backend server;
- Engineers write rigid business logic in code;
- Users fill out locked forms on the front end. The moment a sales director wants to test a one-off tiered rebate for a single client, the software breaks and requires a two-week IT ticket.
Excel obliterated that boundary by making data, interface, and logic occupy the exact same canvas:
- A Floor of Zero: Open a blank workbook and nothing forces you to define a schema, pick data types, or complete an onboarding wizard. Type
100in a cell and it is a calculator; type names and it is a roster; - An Infinite Ceiling: The instant a user types an equals sign (
=), they are writing declarative, reactive code. From=SUM()and=VLOOKUP()to PivotTables (1993), VBA macros, and the 2021 addition of recursive=LAMBDA()functions and native Python in Excel, Microsoft’s formula language is officially Turing-complete. Engineers have built working ray-tracers and 16-bit CPUs entirely inside Excel formulas.
Real-world commerce runs on messy exceptions, midnight “what-if” scenarios, and ad-hoc workarounds. Rigid SaaS databases reject messiness; Excel absorbs it without complaint.
3. The Dark Side of Ubiquity: When Spreadsheets Rename Human Genes and Lose $6 Billion
When a tool becomes so dominant that humanity uses it as a database, a statistical package, and a mission-critical ledger all at once, its design quirks trigger historic disasters.
Excel’s greatest UX flaw stems from its eagerness to guess what novice users mean—specifically its silent automatic type conversion and lack of audit trails:
- The Genetics War—When Scientists Renamed Human Genes to Appease Excel (2020): Twenty-seven human gene symbols look like calendar dates—most notably
MARCH1(Membrane Associated Ring-CH-Type Finger 1) andSEPT2(Septin 2). Whenever researchers imported gene tables into Excel, Excel silently convertedMARCH1into1-MarandSEPT2into2-Sep, permanently corrupting the underlying numeric values. A landmark 2016 study in Genome Biology revealed that 19.6% of supplementary Excel files across leading genomics journals contained corrupted gene names. Rather than waiting for Microsoft to change its defaults (which didn’t happen until late 2023), the HUGO Gene Nomenclature Committee (HGNC) surrendered in 2020 and officially renamed the human genesMARCH1toMARCHF1andSEPT2toSEPTIN2so Excel would stop mangling them; - JPMorgan’s $6.2 Billion “London Whale” Loss (2012): A Value-at-Risk (VaR) model maintained in Excel relied on manual copy-pasting across sheets; a formula error divided by the sum of two days’ volatility rather than their average, cutting perceived risk in half and contributing to a $6.2 billion trading loss;
- The UK’s 15,841 Missing COVID-19 Cases (2020): Public Health England used an automated pipeline that wrote positive test results into legacy
.xlsfiles (capped at 65,536 rows, unlike.xlsx’s 1,048,576 rows). Once the row limit was hit, 15,841 positive cases were silently dropped, delaying contact tracing for tens of thousands of people.
4. Six-Dimension Breakdown: Why 80 Originality Still Ranks #25 in History
Under the unified six-dimension framework of 100 Products That Changed the World (Originality 20%, Scale 20%, Impact 20%, Experience 15%, Business 15%, Durability 10%), Microsoft Excel scores as follows:
| Dimension | Weight | Score | Key Rationale |
|---|---|---|---|
| Originality | 20% | 80 | Dan Bricklin’s VisiCalc (1979) invented the grid; Excel was the ruthless, GUI-first fast follower |
| Scale | 20% | 96 | Over 1 billion active users across every industry, currency, and language on earth |
| Impact | 20% | 93 | Democratized computational modeling for non-programmers and even forced human genetics to rewrite its nomenclature |
| Experience | 15% | 85 | Tactile grid immediacy and PivotTables are masterworks, offset by silent date-mangling and fragile nested formulas |
| Business | 15% | 92 | The indispensable crown jewel of Microsoft Office / 365, generating hundreds of billions in recurring profit |
| Durability | 10% | 97 | Unchallenged for 41 years; even generative AI agents aspire to be its Copilot rather than its replacement |
| Overall (OVR) | 100% | 90.05 | Ranked #25 Overall (right alongside #24 Honda Super Cub at 91.65 and #26 Aspirin at 90.10) |
Today, in the era of frontier AI models, history is repeating itself. Generative AI isn’t killing Excel—every AI lab from OpenAI and Anthropic to Microsoft and Tencent is racing to build agents whose #1 selling point is generating, cleaning, and auditing .xlsx files.
As long as human beings need a two-dimensional canvas to reconcile ambition with reality, the green grid born in 1985 will remain the undefeated mother tongue of business.
Discussion